
In the previous post we talked briefly about why do we need to load test a service. In this post we’ll continue on where we left at the last post on how to load test cassandra. So, lets get started on how to use this amazingly powerful tool; cassandra-stress.
Things to keep in mind:
- Load test should be simulating the real-time scenario. So, it is very important to have this setup as close to the one in production. It is highly recommended that we use a separate node/host in proximity to the cluster for load testing (Eg: Deploy the load test server in the same region if you are deployment is in AWS).
- Do not use any node from the cluster itself for load testing. It is not unusual to think that, since
cassandra-stressis a tool that comes bundled with thecassandradistribution and logically it makes sense to directly use the tool in one of the nodes. Because,cassandra-stressis a heavy-weight process and can consume a lot of JVM resources and can in-turn cloud your node’s performance. - We should also keep in mind that
cassandra-stresstool is not actually a distributed program, so in order to test a cluster, we need to make sure that memory is not a bottleneck, so I would recommend to have a host with at-least 16Gigs of memory.
How to use cassandra-stress:
Step 1 : The configuration file
The configuration file is the way to let cassandra-stress tool to prepare key-space and table and prepare data for the load test. We need to configure a bunch of properties for defining the keyspace, table, data-distribution for the test and the queries to test.
| keyspace | Keyspace name |
| keyspace_definition | Define keyspace |
| table | Table name |
| table_definition | Define the table definition |
| columnspec | Column Distribution Specifications |
| inserinsert | Batch Ratio Distribution Specifications |
| queries | A list of queries you wish to run against the schema |
Now that we have this configuration file ready, we can use this to run our load test by using the cassandra-stress tool. Lets see how to run the tool now.
Step 2 : Command options
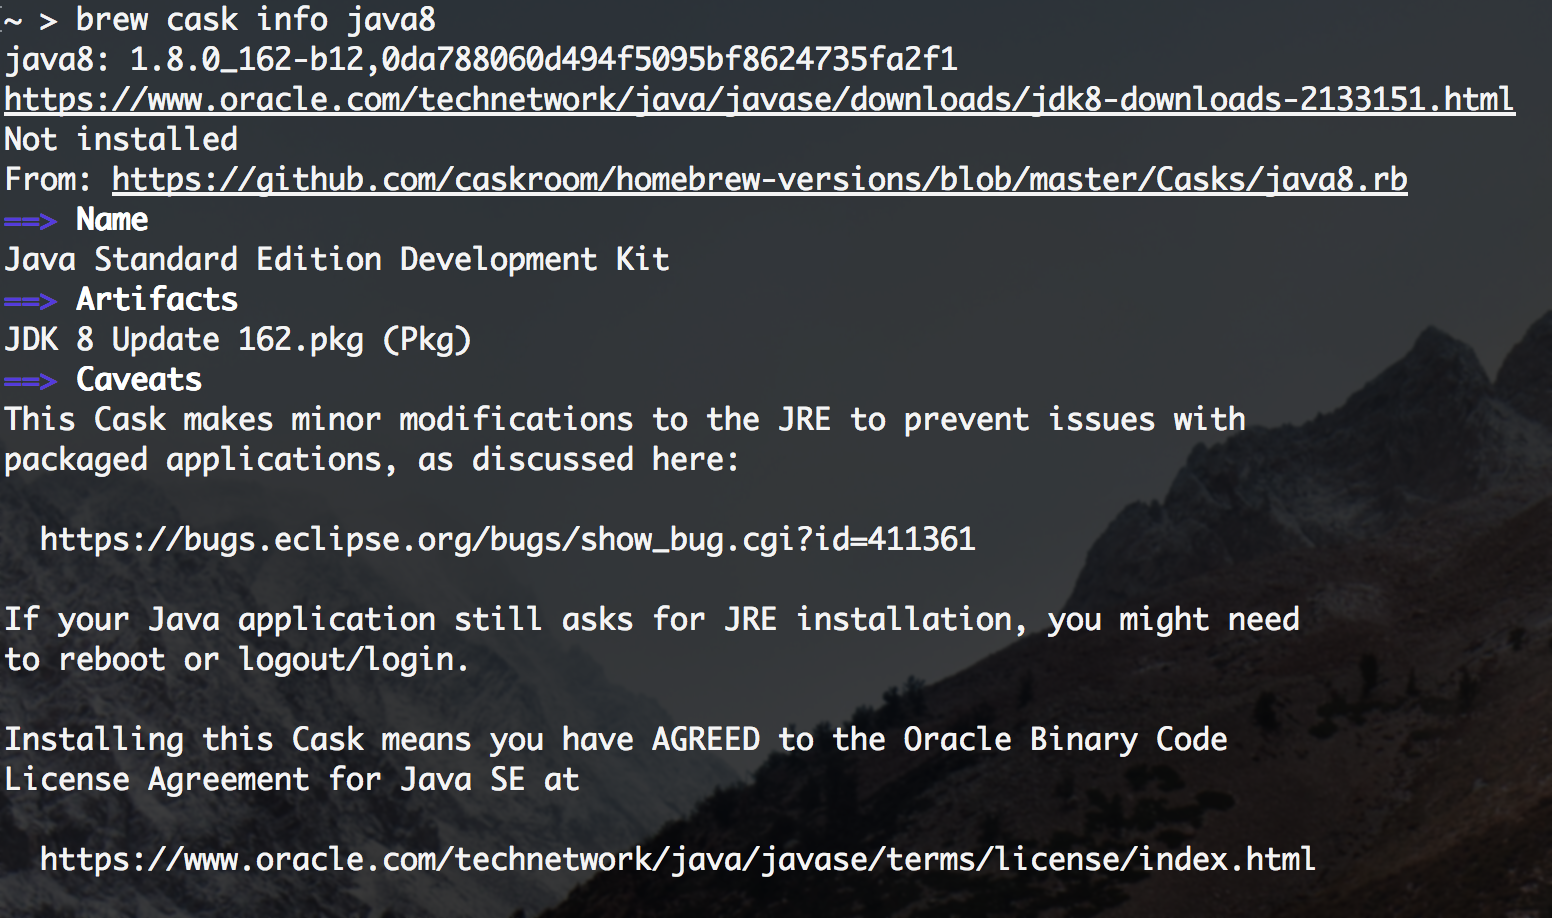
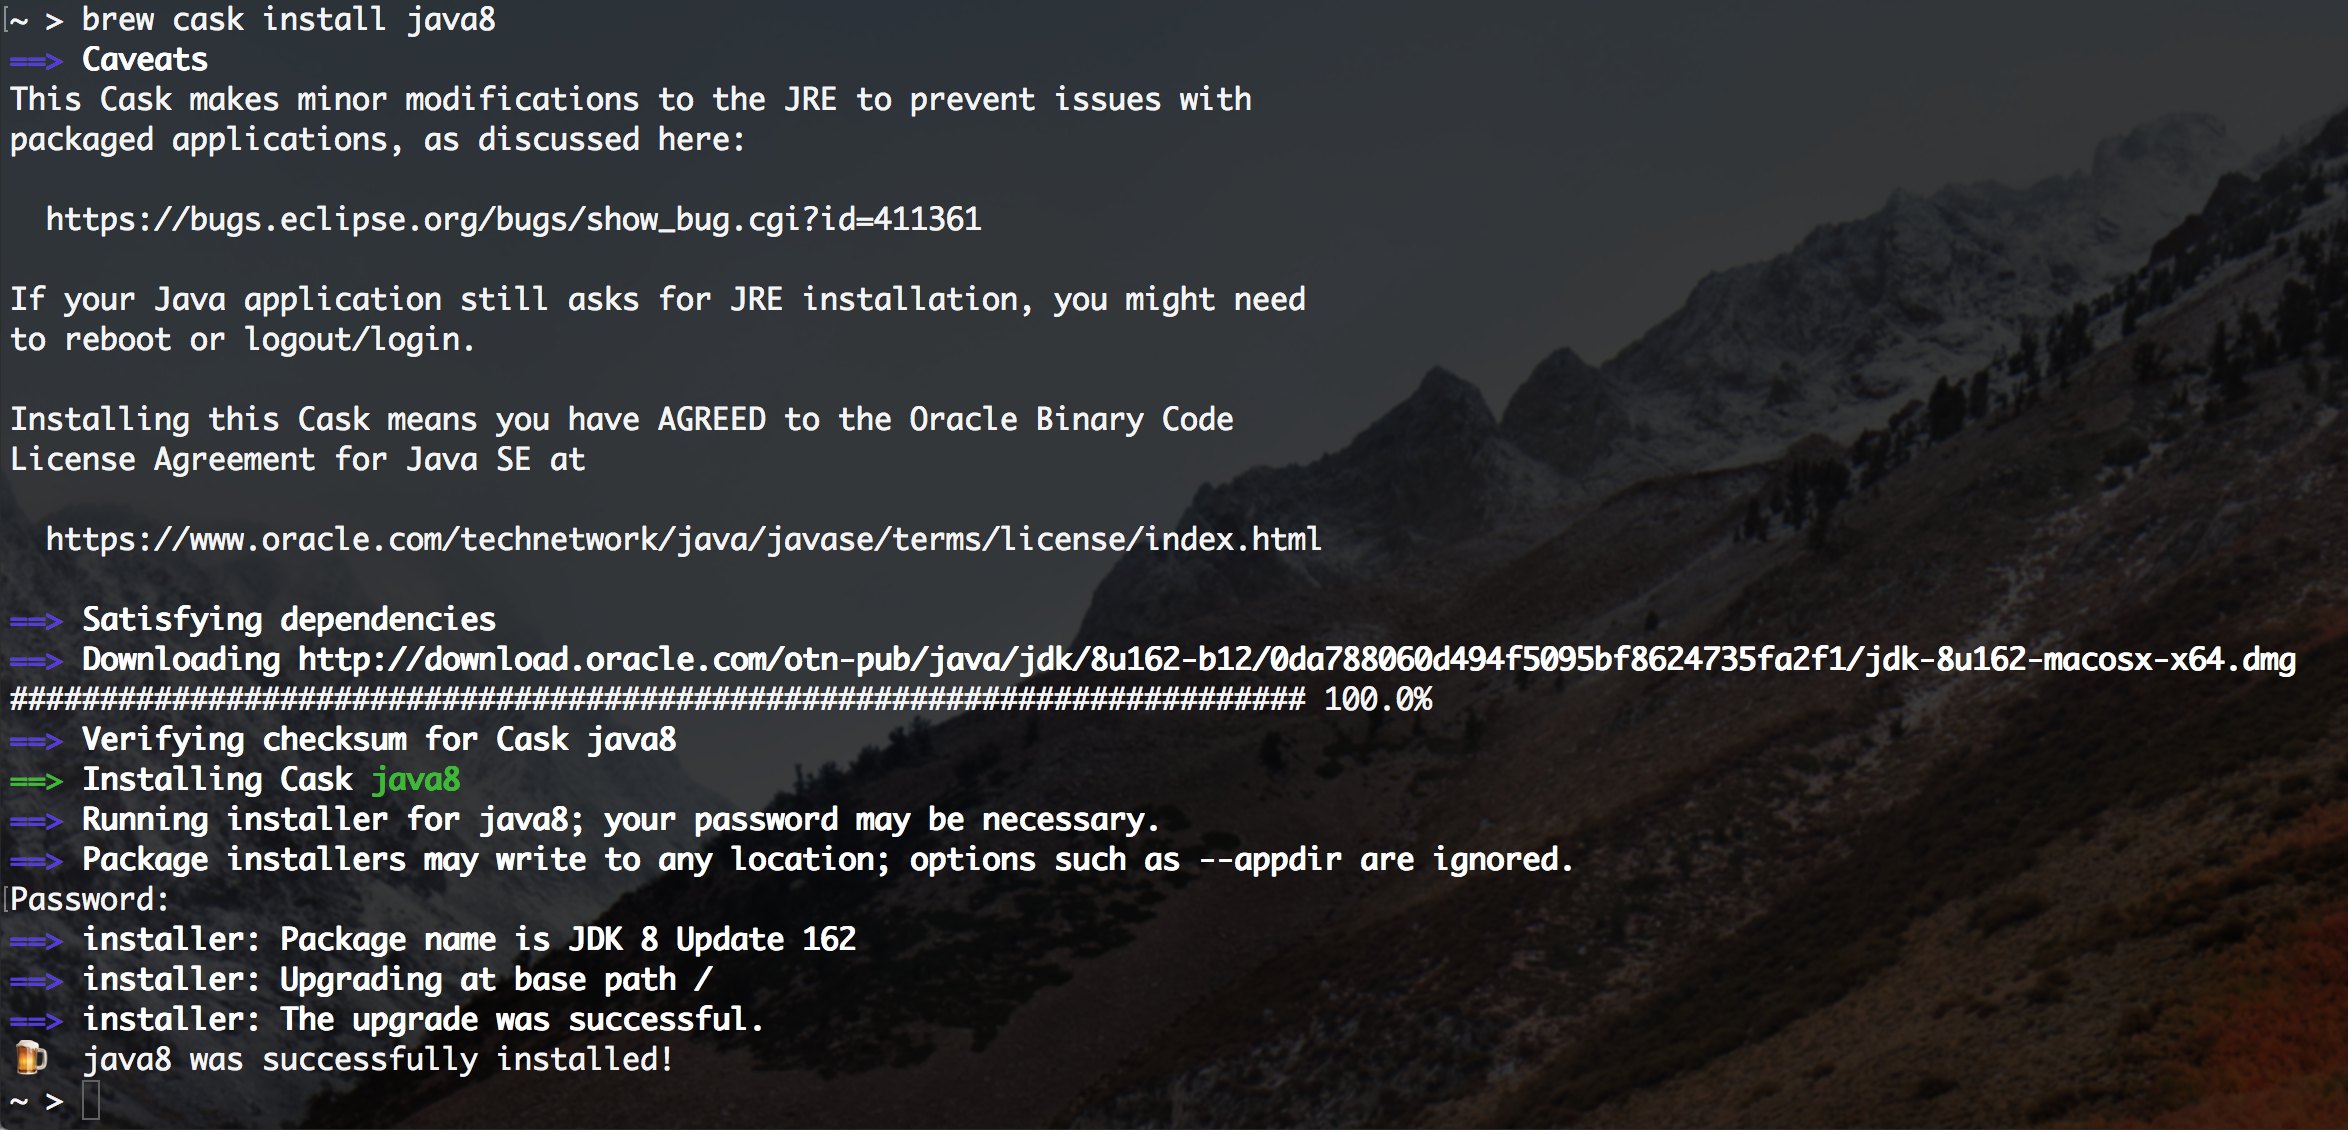
cassandra-stress tool comes bundled with your cassandra distribution download. You will be able to find the tool in apache-cassandra-<version>/tools/bin/.apache-cassandra-<version>/tools/bin/. You can also learn the options available more deeply by checking out the help option in the tool. I will go thru an example and show you how to run the tool in this post.
cassandra-stress user profile=stresstest.yaml duration=4h 'ops(insert=100, queryForUseCase =1)' cl=LOCAL_QUORUM -node <nodelist seperated by commas> -rate 'threads=450' throttle=30000/s -graph file="stress-result-4h-ratelimit-clients.html" title=Stress-test-4h -log file=result.log
Lets go over the options I used one by one to understand what they mean. This is by no means a comprehensive explanation. I would highly recommend giving the documentation a good read to know more about these options.
| user | Specify the tool to say that cassandra-stress is used for running a load test on User specified schema. |
| profile | Specify where the configuration file (yaml file) exist. |
| duration | Duration for which your load test should run |
| ops | Operations defined in the yaml file to be included as part the load test. In our example it is insert and queryForUseCase defined in the yaml file. |
| cl | Consistency level for your operations |
| node | Nodes in the cluster |
| rate | # of threads and peak ops/sec limit |
| graph | Graphical report of the run. Specify the file name and title of the report |
| log | Log file name |
It is as simple as this. The tool will now run for the duration specified and output a detailed report on the run.
I hope you found this helpful and would certainly be delighted to answer any question regarding this.